Testing Your Solution’s Usability to Ensure It Will Meet Your Client’s Needs Is a No-Brainer!
At Tink, we strongly believe that usability tests are more than a sound investment, they’re a given. However, we also concede that there is still a long way to go in terms of education and awareness about usability testing. That is why today we chose to explore the topic of eye-tracking and the remarkable benefits it can bring when evaluating your solution’s functional design.
Before getting to the heart of the matter, let’s review the ins and outs of usability testing
Usability testing is a way of evaluating a digital product by putting it through testing directly with users. What’s interesting with this type of test is that you can test many solutions on one support with a small number of material resources. This makes it possible to test sketches in the form of zoning, wireframes, graphic models and static or interactive mockups. Regardless of the medium, evaluating the usability, effectiveness and level of engagement felt by the user in their experience is key.
What to Expect with Usability Tests
Usability testing is a way to observe the actions of the users interacting with the solution in question. The goal is to record their reactions when they’re using the solution so that you can identify what works well and what needs improvement. The data that is collected is qualitative and may need to be qualified.
Oculometry Explained
Oculometry is a technique that records eye movement. A camera is placed under a screen to capture eye movements and determine where the eye stops. This makes oculometry ideal for diagnosing any problems there may be with website ergonomics. Alternatively, it can be useful to target what has previously been seen by the user to comprehend what works in terms of functionality. The data generated by these measurements are presented in the form of a heat map, areas of interest or eye path.
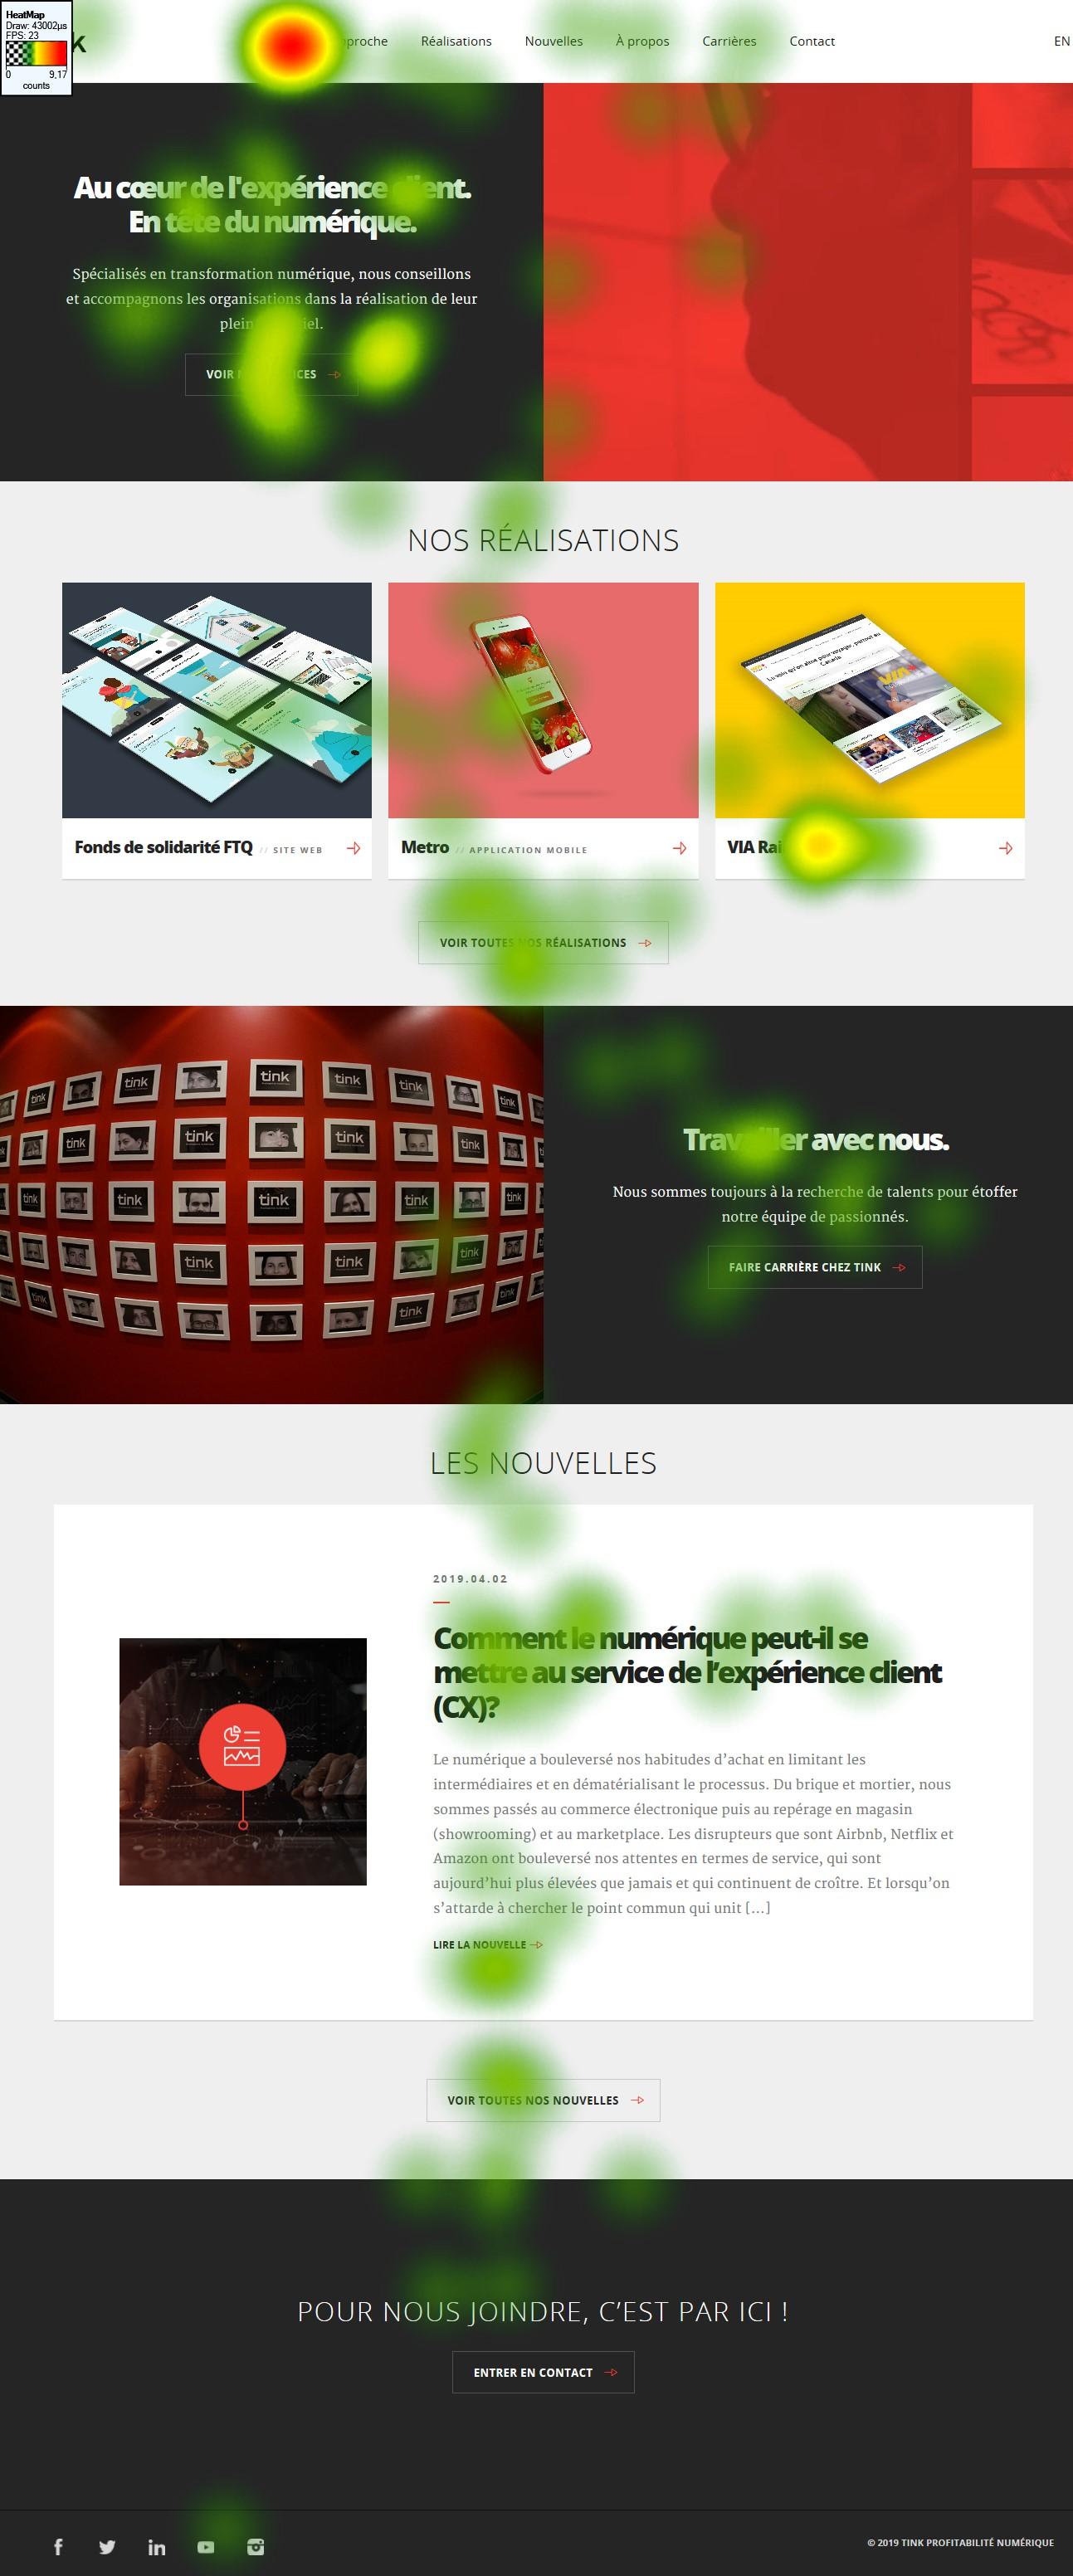
Heat maps illustrate how a person’s gaze is distributed over the interface. There is no information provided on search order with a heat map. It is simply a static representation.
On the heat map, areas of interest are represented using coloured polygons to show parts with the highest concentration of points of gaze recorded during the test. The percentage then indicates the number of users that looked at that area.
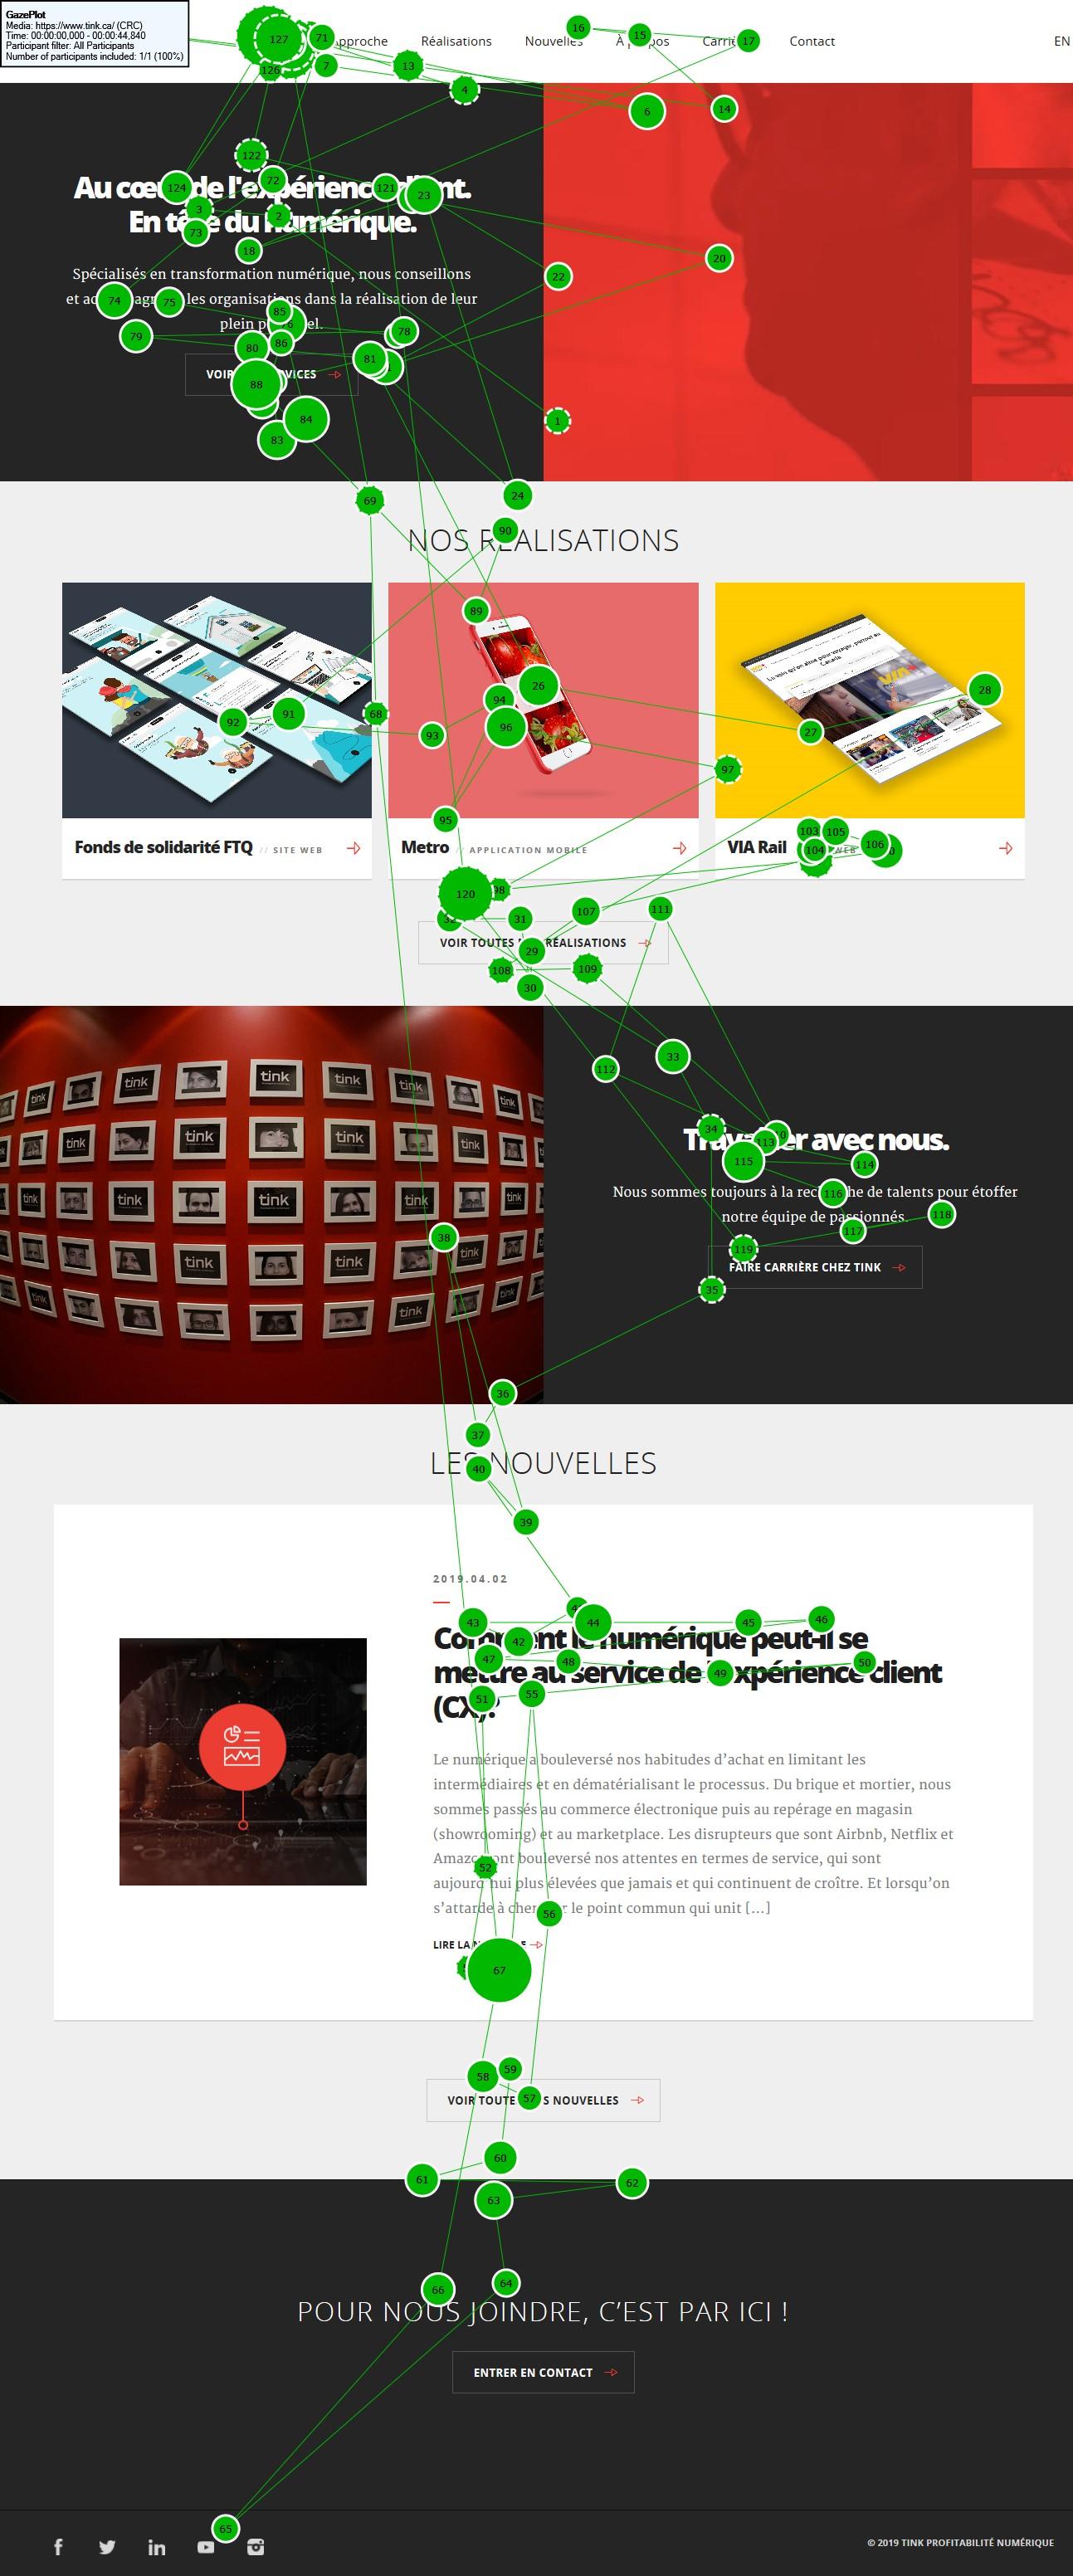
Conversely, eye paths show the location, order and time spent looking at the object being tested. This object could be a web page, navigation, ad banner or a video. Therefore, the eye-trackers reveals the course the user follows when in search of precise information. The time spent searching (expressed in fixation time) is indicated by the diameter of the circles. The longer the gazes persists, the larger the circle.
Qualitative Is Good...but Combining It with Quantitative Is Even Better!
Oculometry has the advantage of following the movements of users’ eyes. This gives a clear idea of what users have observed and what they’ve ignored. This method gives us access to a wealth of information that is accurate and valuable. Data visualization is made possible through quantifiable results. Insights related to behavioural types are then extracted from these data and helps us identify precise behavioural tendencies. By collecting these quantitative data, we can go beyond making assumptions. Analyzing the results is easier and leads to data that is more objective than subjective. This is a definite time-saver.
What Next?
As you may have guessed, the results obtained from usability tests and oculometry are an invaluable amount of qualitative and quantitative feedback. Then comes the time to present the results to the client. The involvement of stakeholders in the resulting progress is encouraged to ensure the optimization of the process. However, keep in mind that a usability test is part of a scientific practice, where the processes are strict, to say the least. The people involved have to understand that what is being shared is only the sum of the users’ feedback, not anyone else’s opinion.
After analyzing these results, you can then start to optimize your solution. And don’t forget about testing it once more to maximize the success of your solution!